Variously Noted
Anatomy of a PermGen Memory Leak
What is the PermGen?
The Permanent Generation (PermGen) Heap is a heap in the JVM dedicated to storing the JVM’s internal representation of Java Classes (and also interned String instances). In the Oracle JVM, the heap is a fixed size, if an attempt is made to load more class instances than will fit in this area then a OutOfMemoryError is thrown, even when there is still plenty of space on the other heaps. You can increase the PermGen heap size with the -XX:MaxPermSize flag, but typically increasing the heap size is just putting of the inevitable, instead of addressing the root cause. A memory leak, in Java? Yup, it happens. When something holds onto a reference to an object instance, it cannot be garbage collected, eventually if enough errant references are held, or the graph of other references onwards from the errant reference is large, the GC cannot free enough memory and the heap is exhausted. Every Java Object holds a reference to it’s own java.lang.Class object and every java.lang.Class in turn holds a reference to the class loader that instantiated it. Each class loader holds a reference to every class that it has instantiated. That is potentially a very big graph of references. Here’s the point: If an object instantiated by one class loader holds a reference to an object in another class loader, then the latter object cannot be garbage collected until that reference is given up, which means it’s class object cannot be garbage collected, which means it’s class loader cannot be garbage collected, which means none of the classes instantiated by that class loader can be garbage collected. So you can see even one errant reference can cause a lot of memory wastage, particularly if the target of the reference happens to have been instantiated by a class loader that instantiated a lot of classes. The Tomcat wiki enumerates just some of the ways this can happen, and this great presentation by Mark Thomas goes into more detail on this topic. In fact the problems are so prevalent that many application containers already include logic to try address these leaks themselves.
Finding the errant reference
So you’ve got a PermGen error and you want to find the root cause, let’s work through a Tomcat specific example to get a flavour for how to go about tackling this kind of problem. Every web application in Tomcat gets it’s own class loader instance, this is to prevent one application interfering with another. However each class loader will always share a single class loader parent, the boot class loader, which is responsible for loading all of the JRE classes. If an object instantiated by the boot class loader were to hold a reference to an object instantiated by the webapp’s class loader then that would lead to the scenario described above, where the webapp’s class loader would remain referenced and therefore ineligible for garbage collection. Eventually after the nth redeploy of the web-application a PermGen java.lang.OutOfMemoryError error will occur, as the class loader for each deployment of the application remains in memory until the heap is exhausted. We need to hunt down these web application class loader instances, and figure out what is holding on to them.
Java Visual VM
This needle in a haystack hunt used to be quite painful, but since JDK6 (Update 7 or later) we have a great tool that ships with the JDK that makes things much easier: VisualVM. VisualVM is a graphical tool that can connect to any JVM, allow you to take a dump of the JVM’s heap and then let you navigate that heap. In Tomcat, the class loader for a web application is a class named:org.apache.catalina.loader.WebappClassLoader. If our Tomcat instance has only one web application deployed, then there should be only be one instance of this class in the heap. If there’s more than one, then we have a leak. Let’s use VisualVM to check this out: Start Visual VM by typing:
|
|
You’ll a screen similar to the following: 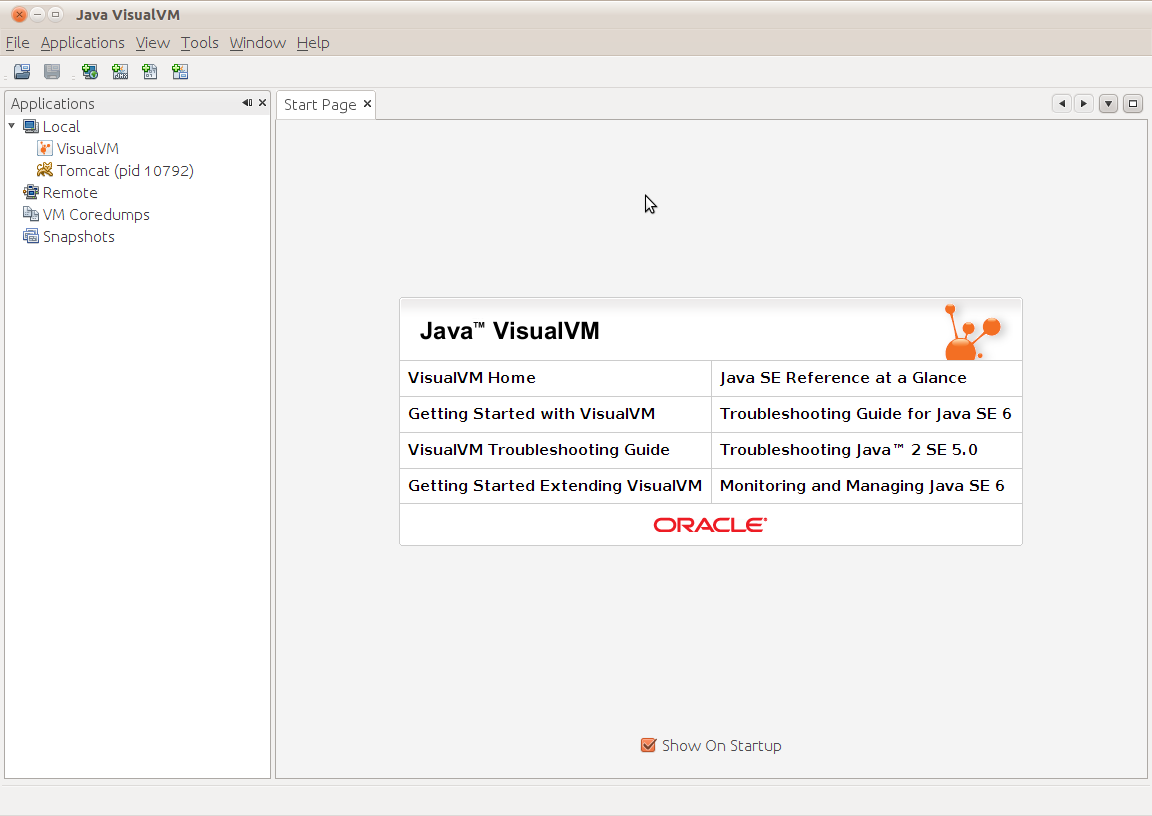 Notice in the left hand pane, a list of current JVM processes is shown, right click Tomcat in the list and choose ‘Heap Dump’. You’ll now see something similar to the following:
 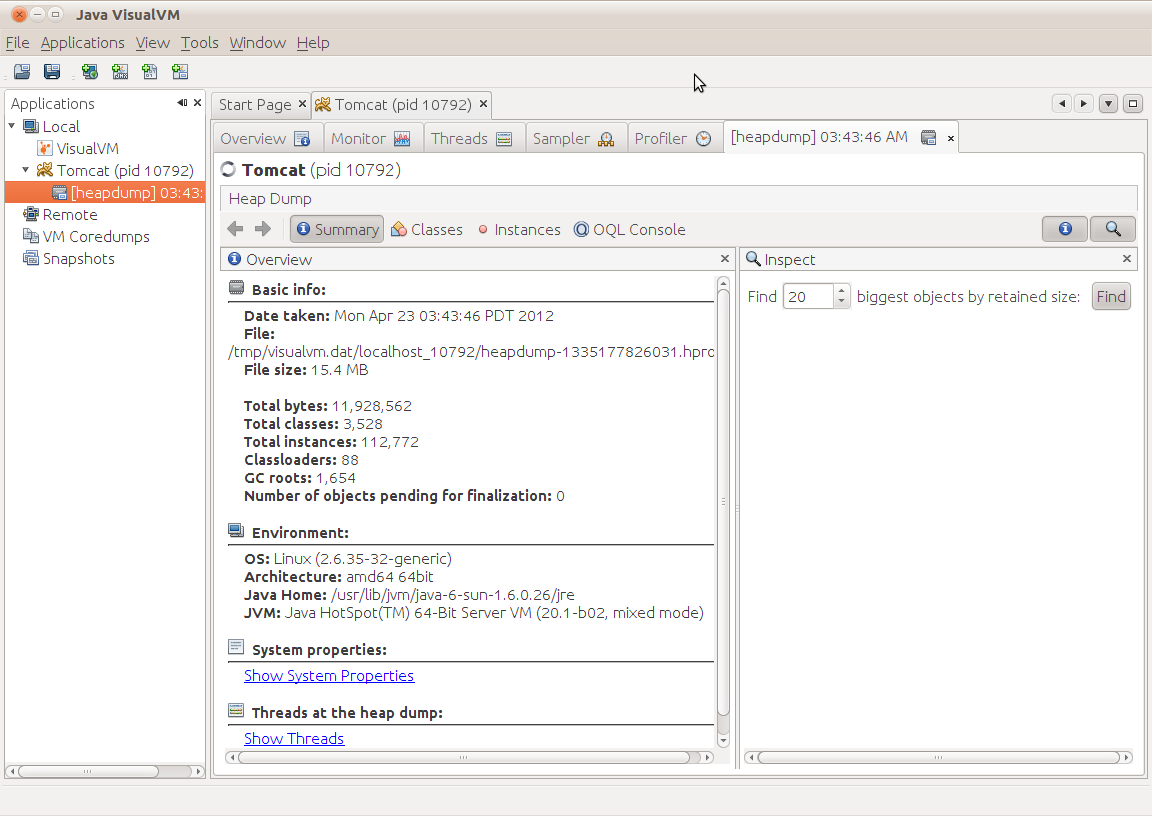 Click the ‘OQL Console’ button. This displays a console that allows you to query the heap dump. We want to find all instances of :
 org.apache.catalina.loader.WebappClassLoader. Enter the following in the Query Editor pane:
|
|
Press Execute and you will something similar to the following: 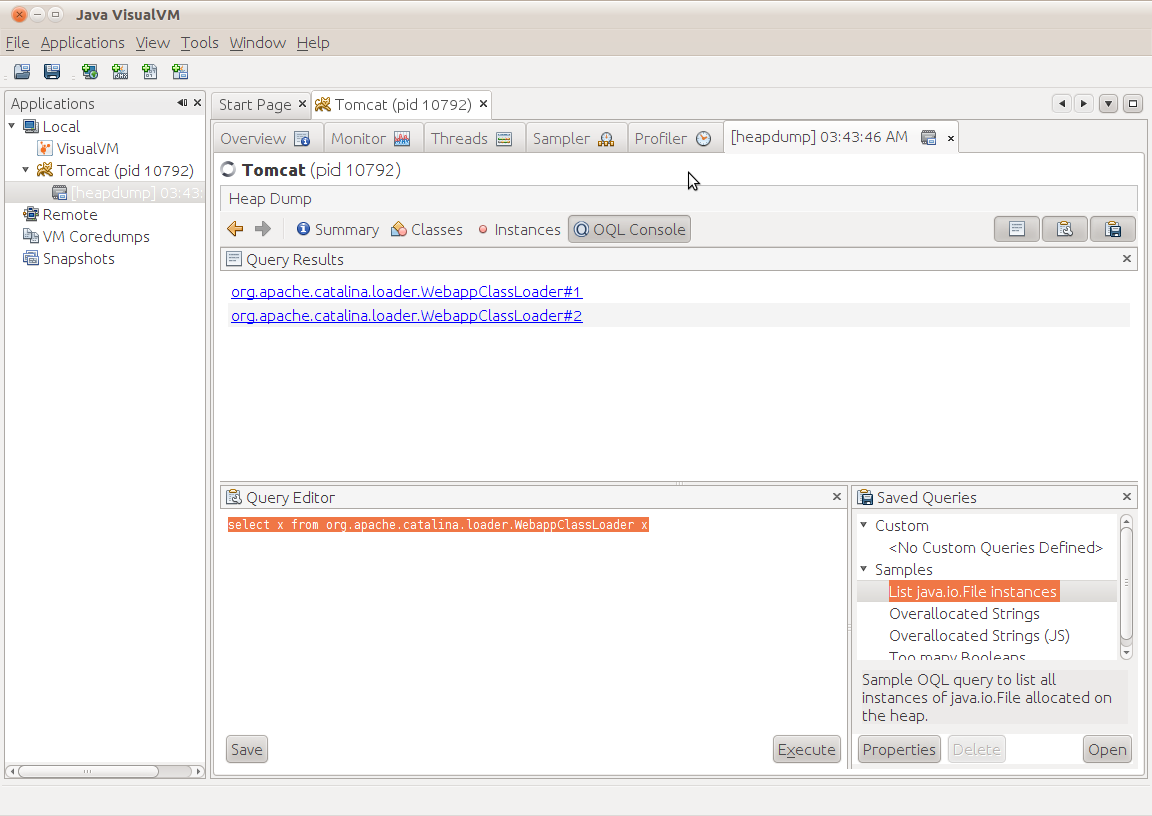 In this case, VisualVM found two instances of the web application classloader, one for the application itself and one for the Tomcat manager application. Use the Tomcat manager application to restart the web application (
http://localhost:8080/manager/html), and take another heap dump of the Tomcat process. Navigate back to the OQL Console and enter the same query again: 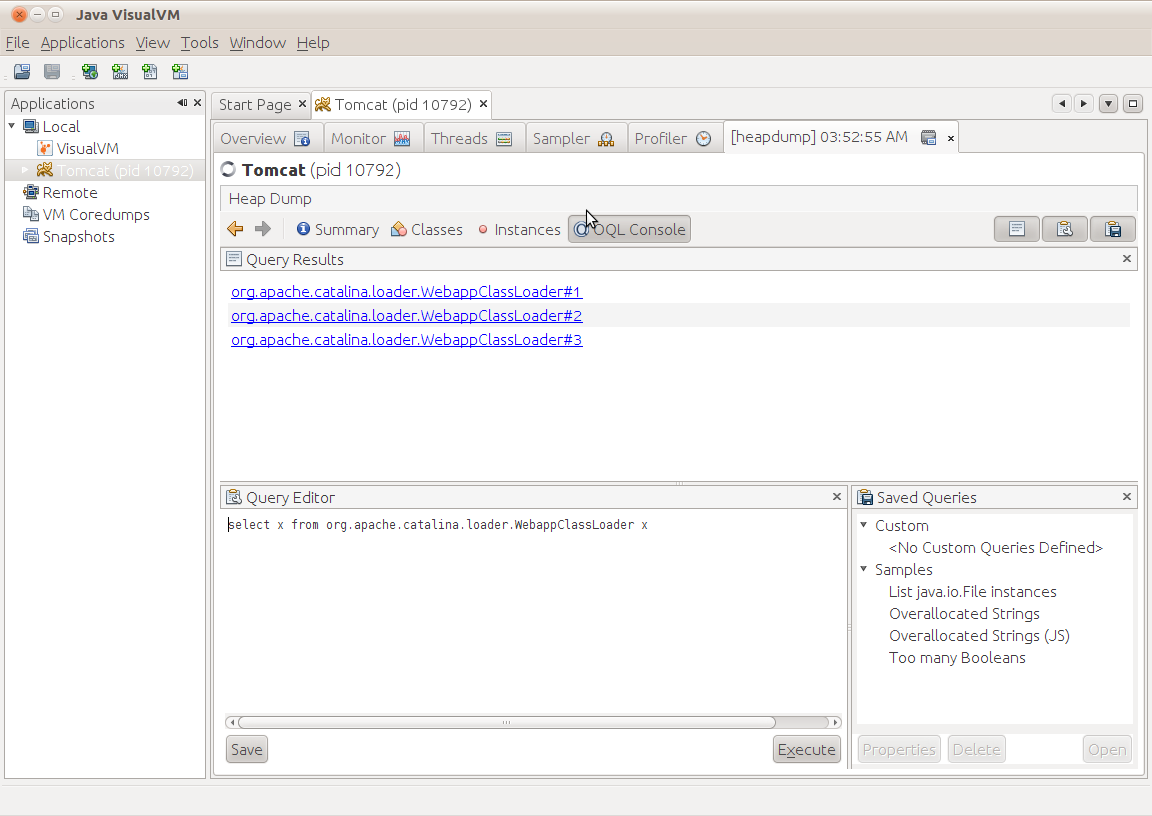 Notice how there are now 3 instances, we have a leak, one of these 3 instances should have been garbage collected but wasn’t, which one is it? In Tomcat there is an easy way to tell, active class loaders have a field named:
 started which is set to true. Click through each class loader instance until you find the one whose started field is false. 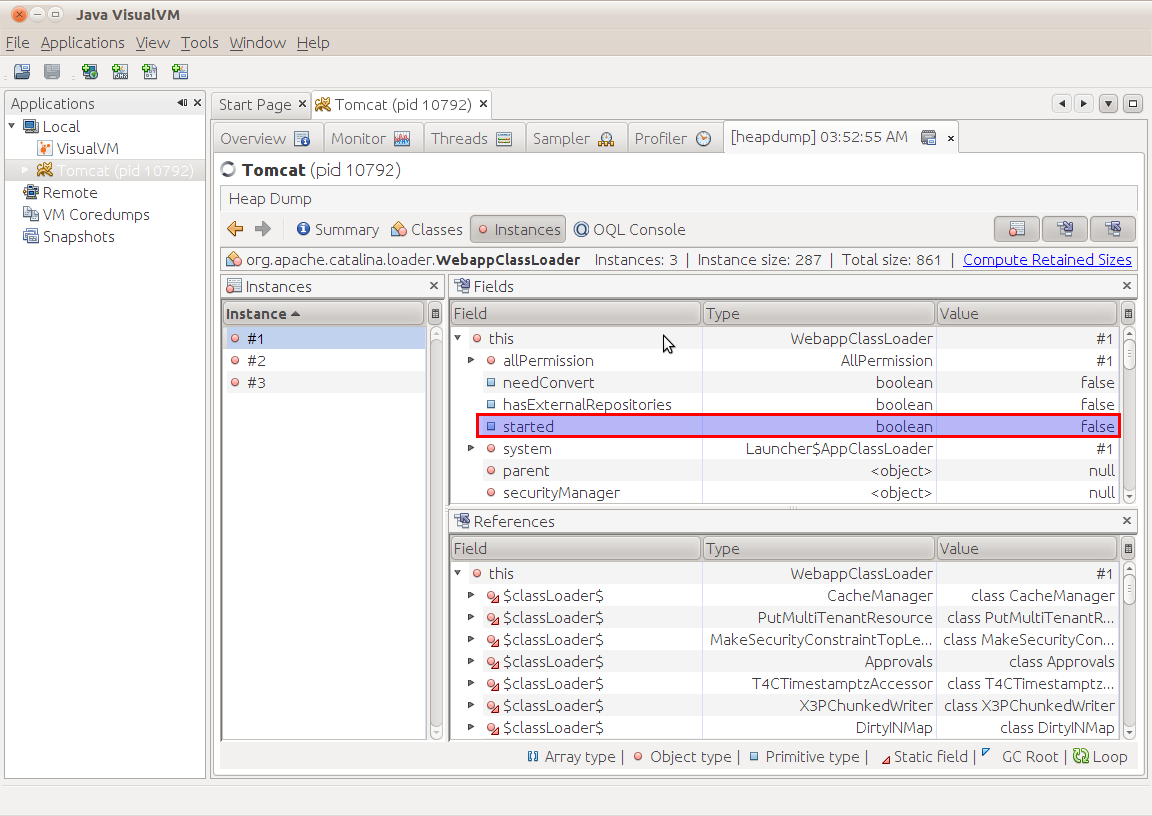 Nearly there, we’ve found the class loader instance that has leaked, now we need to determine what object is holding a reference to the class loader. Lots of objects will be holding references to the class loader, and in turn each of those objects will be referenced by many other objects, but ultimately there will be one or a very few objects that will form the root of this graph of references, that’s the object(s) we are interested in. So in the bottom pane, right click on the this reference and select ‘Show Nearest GC Root’. You’ll see something like the following:
 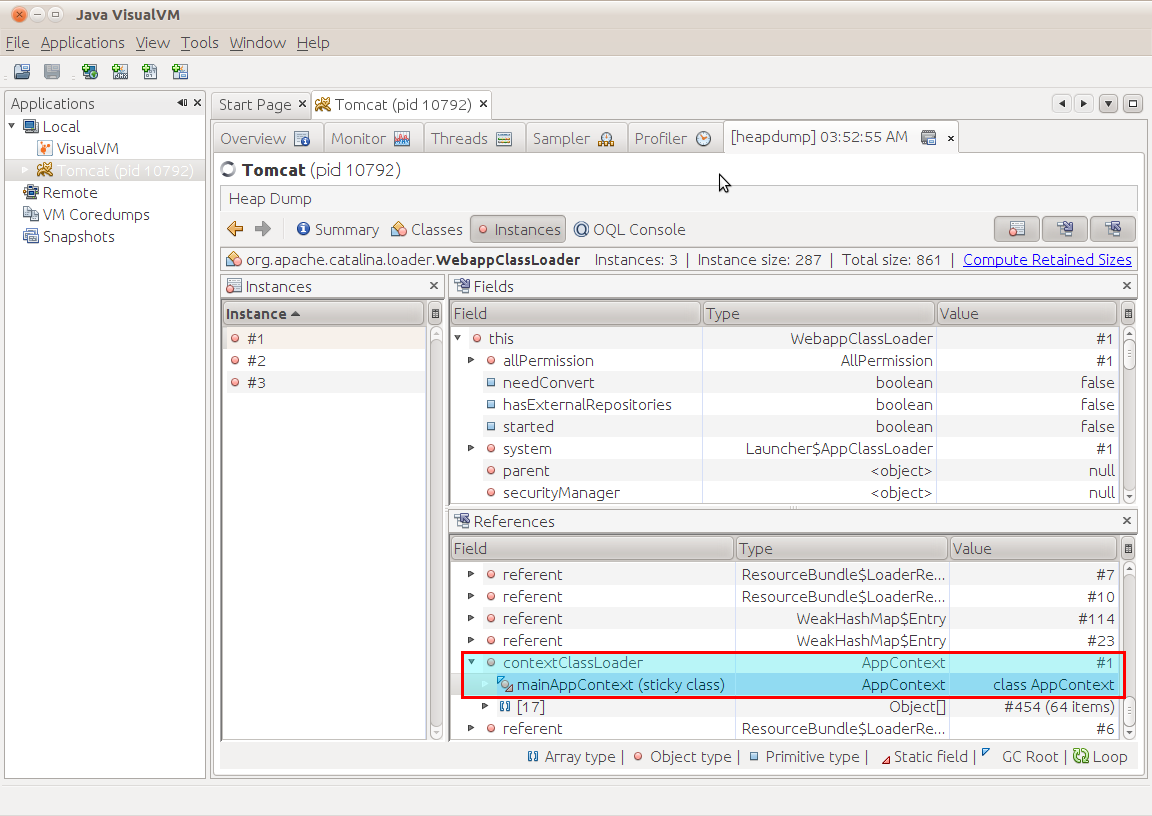 Right click on the instance, and select ‘Show Instance’
 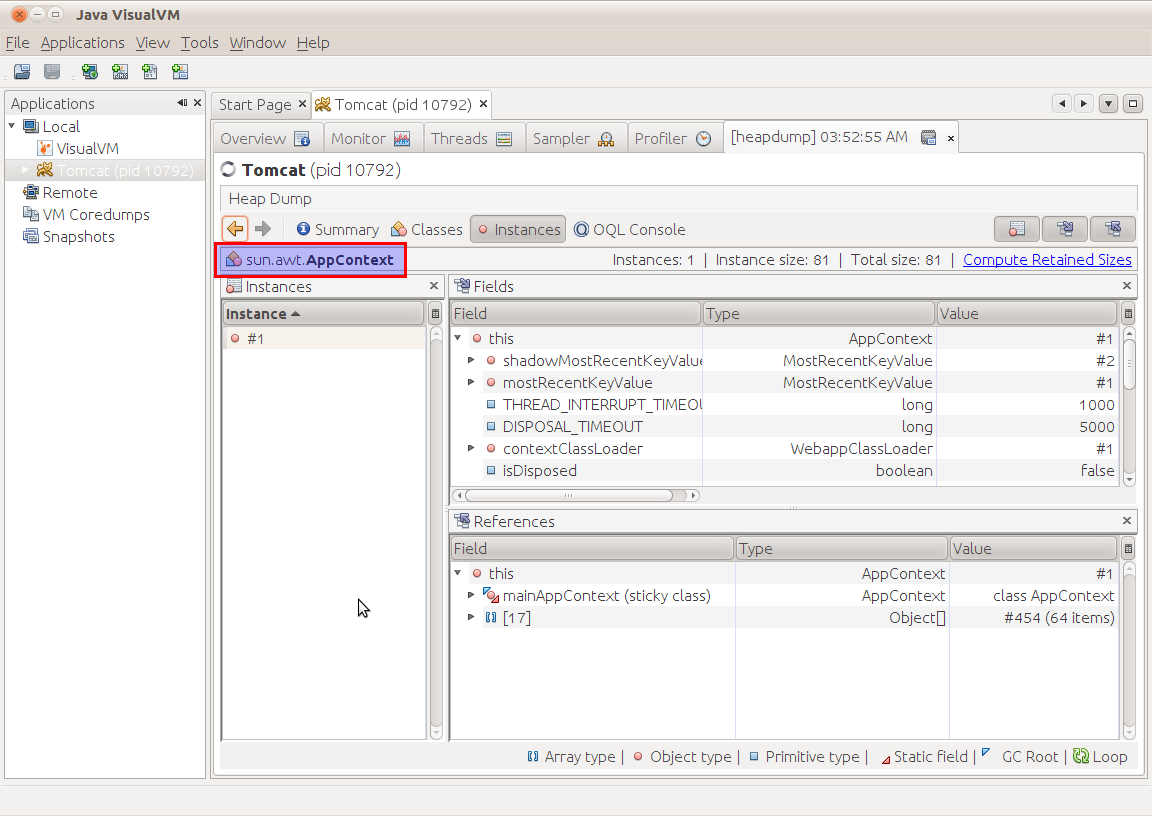 We can see that this is an instance of the
 sun.awt.AppContext type. You can see that the contextClassLoader field in AppContext is holding a reference to the WebappClassLoader. This is the errant reference that is causing the memory leak. sun.awt.AppContext type is not a class I’m familiar with myself, time to figure out who/what is instantiating it. Restart your tomcat in debug mode, I use:
|
|
Now we need to remote debug the class loading sequence, I’m going to use Eclipse to do this. We need to set a class load breakpoint on sun.awt.AppContext:
- Use the Open Type Prompt (Shift+Control+T) to locate the
sun.awt.AppContexttype. - Right click on the class name in the Outline pane, and choose ‘Toggle Class Load Breakpoint’
Now we need to trigger the class loading sequence. Connect your debugger to the Tomcat instance, and the debugger should stop at the point where sun.awt.AppContext class is loaded: 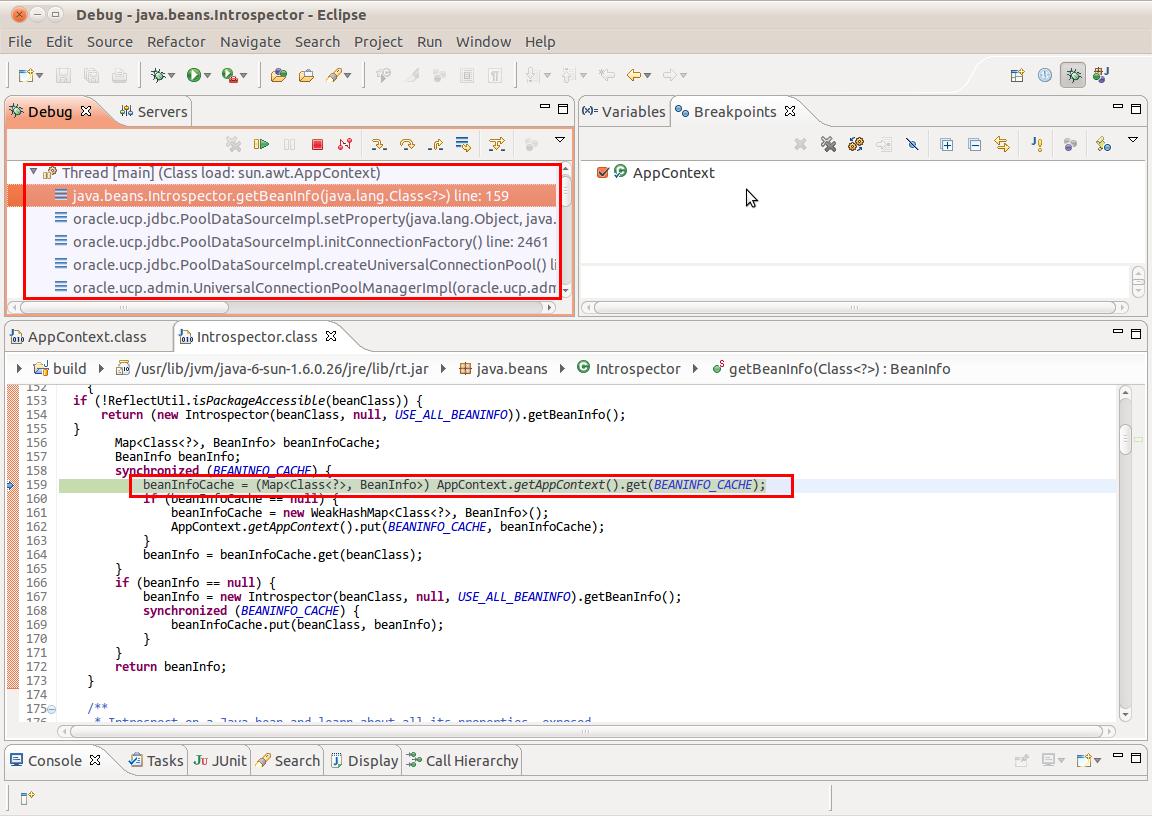 Aha, it’s been instantiated by the JavaBeans framework, which in this instance is being used by the Oracle Universal Connection Pool (UCP). We can also notice that the
 contextClassLoader is a final field and it looks like AppContext is a singleton, so we can infer that this field is set once and once only during the instantiation of AppContext. So we have established that it’s code within our application that is provoking the leak. Now we need to figure out a cure. At application startup, we need to assure that when sun.awt.AppContext is initialized WebappClassLoader is not the current context class loader. Something like the following should work:
|
|
I added this code to my servlet context listener, causing it to execute during application start-up and it had the desired effect, curing this particular memory leak.
Summary
In JEE Applications, the root cause of a PermGen out of memory errors usually lie in the application itself (or a library used by the application), often compounded by classes in the JRE library holding references to the web application class loader or objects instantiated by the web application class loader. The process for finding the root cause of a leak is to use a heap analyzer like VisualVM to find the uncollected web application class loader instance, and then find the root GC object that is directly or indirectly holding onto the class loader. When you find this object, use your debugger to discover how this object is being instantiated and then devise a way to modify it’s behaviour so that it does not continue to hold on to the class loader reference forever.